Identifying Viable Location for a Veterinary Startup
Startup
September 26, 2024

Embarking on the journey of starting a veterinary practice demands more than a passion for animal care; it requires a strategic understanding of your target market to align services with local needs. The pivotal phase of identifying the right location shapes not only your business strategy but also sets the tone for effective marketing efforts. Let’s delve into a step-by-step guide to navigate this critical phase of launching your veterinary startup.
Identify Target Market Location: Commute Distance

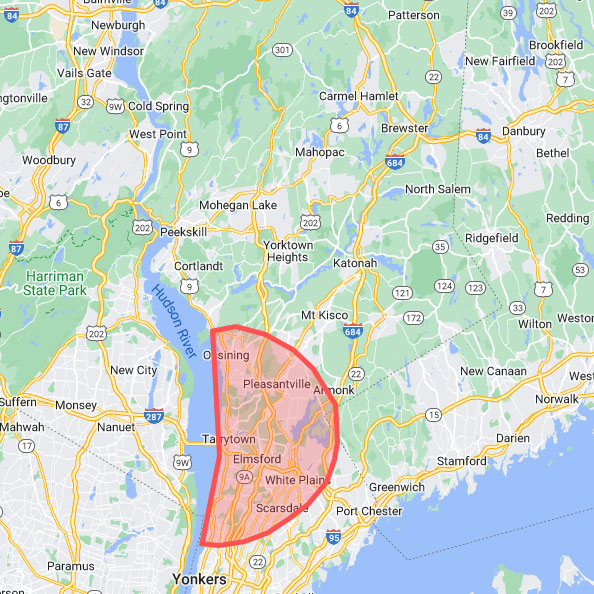
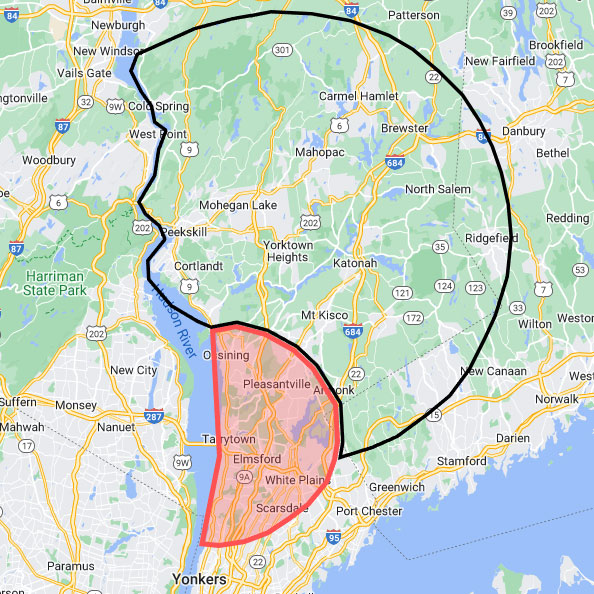
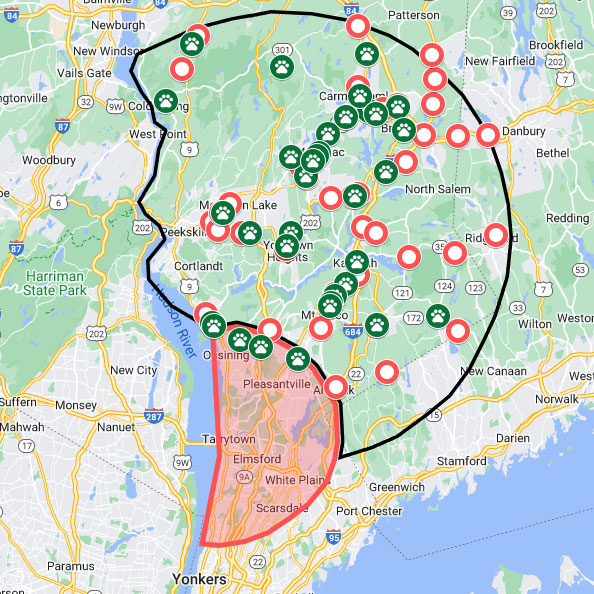
Understanding the geography and demographics of your target market is fundamental. Consider commute time as a decisive factor, aiming for a boundary within the regional average of 40 minutes, unless relocation is a viable option
Non-Compete: Navigating Legal Waters
Dealing with non-compete clauses in corporate clinic employee contracts demands careful consideration. Learn from personal experiences that underscore the potential time and resource consumption. Be prepared for legal challenges if you choose to remain within the bounds of your non-compete agreement.
Competition Analysis: Strategic Visualization
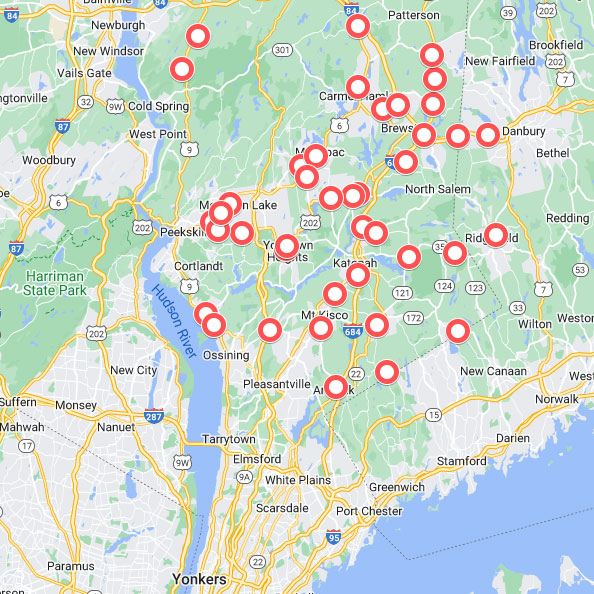
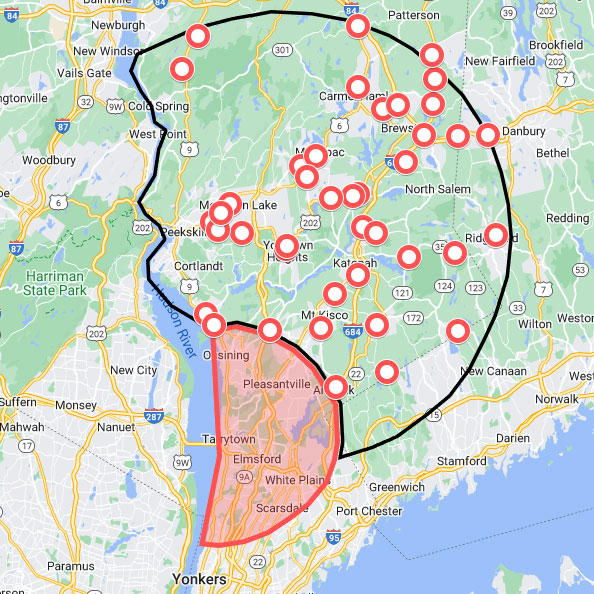
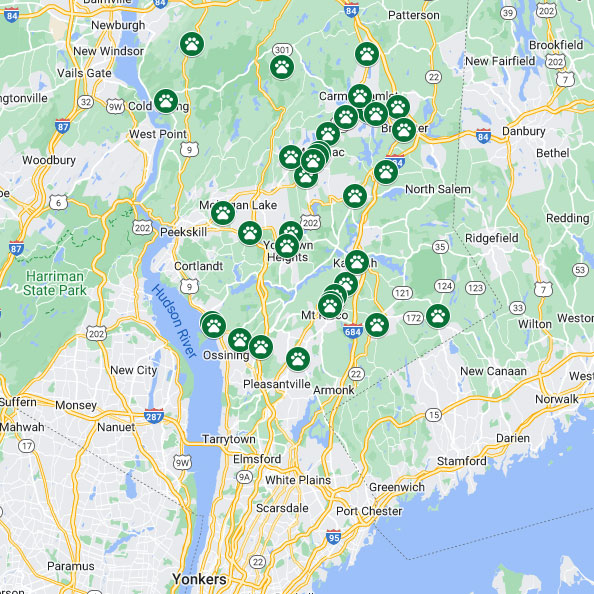
Analyze the competitive landscape strategically by integrating location data of current competitors onto a map. This visual representation aids in pinpointing clusters or gaps in the market, facilitating informed decision-making for the optimal location.
Complementary Businesses
Plot the locations of businesses offering complementary products or services, such as pet supplies and dog groomers. This mapping approach visually pinpoints potential spending zones for pet expenses, aiding in strategic positioning.
Competitive Landscape
Examine the competitive landscape within specific zip codes, considering the number of vet clinics, total doctors, households, and households per vet. This data-driven approach informs your understanding of market dynamics.
Zip Code
| Location | Vet Clinics | Total Dr’s | Households | Households Per Vet |
|---|---|---|---|---|
| A | 3 | 7 | 6,695 | 956 |
| B | 2 | 5 | 6,305 | 1,261 |
| C | 4 | 9 | 8,536 | 984 |
| D | 5 | 9 | 10,644 | 1,183 |
top 4 zip codes with highest *household to veterinarian ratio
*number of households divided by total number of full time veterinarians
5 mile radius
| Location | Vet Clinics | Total Dr’s | Households | Households Per Vet |
|---|---|---|---|---|
| A | 7 | 11 | 22,143 | 2,013 |
| B | 9 | 15 | 44,578 | 2,972 |
| C | 14 | 16 | 35,841 | 2,240 |
| D | 16 | 25 | 64,875 | 2,595 |
top 4 zip codes with highest *household to veterinarian ratio
*number of households divided by total number of full time veterinarians
Complementary Business Landscape
| Location | Number of Complementary Businesses | Households | Households Per Business |
|---|---|---|---|
| A | 4 | 6,695 | 1,674 |
| B | 7 | 6,305 | 1,265 |
| C | 5 | 8,536 | 1,261 |
| D | 4 | 10,644 | 2,661 |
Regional Statistics
Population Demographics:
Age distribution: Look for areas with a significant number of pet owners, and consider the age groups most likely to have pets, such as families and individuals in their 30s and 40s.
Population density:
Higher population density can indicate a larger potential client base in a given area.
Income Levels:
Median household income: A higher median income suggests that residents may have more disposable income to spend on veterinary services for their pets.
Income distribution:
Understanding the distribution of income levels can help tailor your services to the financial capacity of the local population.
Education Levels:
Areas with higher levels of education may have residents who are more likely to prioritize the health and well-being of their pets, leading to a higher demand for veterinary services.
Create a Market Size Estimate:
Combine the gathered data to estimate the potential market size for your veterinary clinic. Consider both current and future projections to assess the long-term viability of the location.
Utilize Online Tools and Databases:
Leverage online tools and databases that provide market insights, demographic data, and consumer behavior analytics. Explore platforms like IBISWorld, Statista, AVMA Pet Ownership and Demographic Sourcebook, or local government databases for relevant information.
| Westchester County | |
|---|---|
| Percentage of population between 18 & 65 | 60.7% |
| Household income | $105,387 |
| Percentage of population with bachelor’s degree or higher | 50.6% |
| Population Density | 2,247 Per Sq Mile |
Demographic Comparisons
Micro-Demographic Differences:
Zip codes can represent smaller, more localized communities within a county. Examining data at the zip code level allows you to identify micro-demographic differences that may not be apparent when looking at broader county-level data.
Targeted Marketing:
Understanding the specific demographics of a particular zip code enables you to tailor your marketing strategies to the unique characteristics of the local population. This can include crafting advertising messages, promotions, and services that align with the preferences and needs of residents in that specific area.
Economic Variability:
Economic conditions can vary widely within a county. Examining income levels and spending patterns at the zip code level allows you to pinpoint areas with higher economic potential, ensuring that your clinic is situated in a location where residents can afford your services.
Strategic Decision-Making:
By comparing data at both the county and zip code levels, you can make more informed and strategic decisions. This might include selecting a location that not only aligns with county-level trends but also capitalizes on the unique characteristics and opportunities presented by specific zip codes.
| Westchester County | Location A | Location B | Location C | Location D | |
|---|---|---|---|---|---|
| Percentage of population between 18 & 65 | 60% | 59% | 65% | 62% | 51% |
| Household income | $105,387 | $101,015 | $149,251 | $141,159 | $165,135 |
| Percentage of population with bachelor’s degree or higher | 50% | 47% | 62% | 52% | 63% |
| Population Density | 2,247 Per Sq Mile | 1,751 Per Sq Mile | 1,917 Per Sq Mile | 2,041 Per Sq Mile | 1,568 Per Sq Mile |
| Location B | |
|---|---|
| Households within 5 miles | 44,578 |
| Households with Dogs | 20,060 |
| Households with Cats | 11,144 |
| Market Size | $16,142,808 |
Market Size
Estimating the market share that a new business can capture against existing competition involves a thoughtful analysis of several factors. Understand Total Market Size within a 5 mile radius:
Estimate the total market size by using industry reporting and regional statistics
45% households have a dog and spend $650 per year
25% households have a cat and spend an average of $282 per year
Estimate Your Business’s Potential Revenue:
Estimate the potential revenue your business could generate based on projected sales volume and pricing using industry reports, your own production reporting and industry statistics
2 Doctor practice revenue target is $1,300,000 per year or 8% of the market
Adding a 2 doctor practice would represent 11% of the service providers in an area with 15 veterinarians
The key being your target market share is smaller than than the percentage of service providers you represent.
Location Comparison: Unveiling the Optimal Choice
Compare locations within Westchester County based on population, income, education, and density. Analyzing the data, Location B emerges as the optimal choice, standing out with high demand, robust support for complementary businesses, a favorable demographic profile, and above-average household income.
